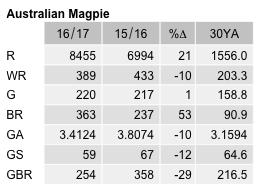
Australian Magpie
Gymnorhina tibicen
ABR description
The following is extracted from the Annual Bird Report for the twelve months to June 2017.
Very common, breeding resident
An iconic native species. Continues recent history of being well above the long-term figures on key parameters. The most reported species.
General: Number of birds (39,696) similar to last year’s figure (35,310), though many more than the 10YA (12,091) and the 30YA (6,021). Recorded in all weeks, with a lower proportion in winter (21%) than in spring (26%), summer (25%) and autumn (28%). Records from 71% of grid cells surveyed, similar to last year (73%), the 10YA and the 30YA (both 72%). Reporting rate the same as last year (60%) and in the same range as the 10YA (59%) and the 30YA (57%). 8th most abundant species (2.8050), abundance similar to last year (3.0172) and the 10YA (2.5481) though higher than the 30YA (2.2098). Max 135 (136 last year), mean 4.7, median 3. 365 breeding records (237 last year) in each month except May, with a large peak in Oct, mostly dy.
GBS: Number of birds (8,763) fewer than last year (11,072) and the 10YA (11,091) though more than the 30YA (8,596). Number of records (2,388) a little less than last year (2,709), the 10YA (2,948) and the 30YA (2,423). Recorded in all weeks, with similar numbers of records in each season. Records from all sites. Most recorded and 3rd most abundant species, abundance similar to that of last year and the 10YA (3.4647) and the 30YA (3.1594). Max 46/1 wk Oct Curtin (AjR1), mean 3.7, median 3. 254 breeding records (358 last year) from 29% of sites in all months Jul-Feb, with a strong peak in Oct/Nov, plus a dy in May and nest-building for the next season in Jun.
Abundance
Abundance is the average number of birds of that species per survey. Where the species was observed (presence recorded) but the number of birds seen was not recorded, this is treated as a count of zero.
Abundance by year
This chart shows the abundance of Australian Magpie between 1982 and 2017. 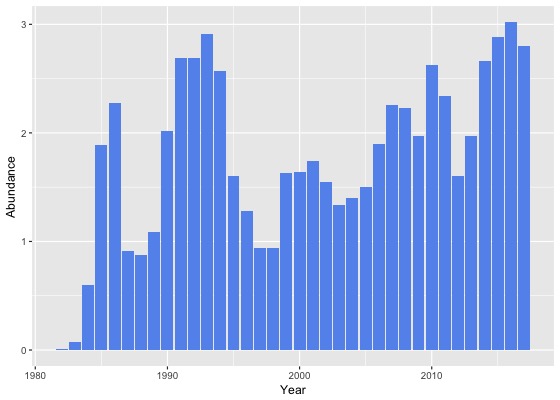
Abundance by month
This chart shows the monthly abundance of Australian Magpie. The blue lines show the abundance for the twelve months to June 2017 and the bars show the average abundance for the period 1982 to 2017. 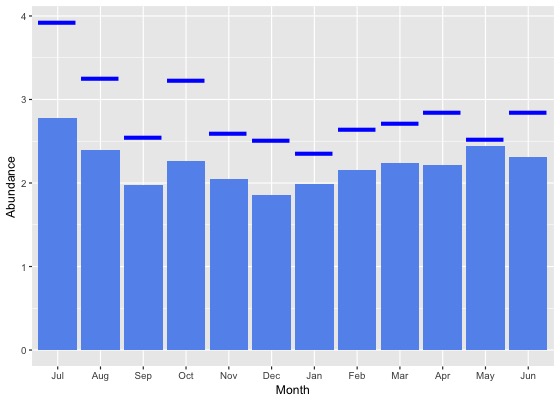
Abundance by season
This chart shows the seasonal abundance of Australian Magpie. The blue lines show the seasonal abundance for the twelve months to June 2017 and the bars show the average seasonal abundance for the period 1982 to 2017. 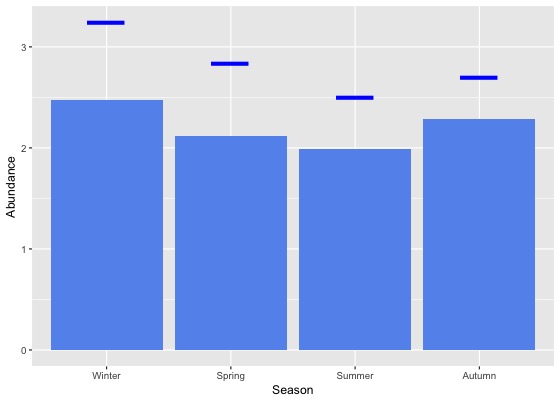
Abundance data
| Month | Season | ||||||||||||||||||
|---|---|---|---|---|---|---|---|---|---|---|---|---|---|---|---|---|---|---|---|
| Period | Jul | Aug | Sep | Oct | Nov | Dec | Jan | Feb | Mar | Apr | May | Jun | Winter | Spring | Summer | Autumn | All | ||
| All years | |||||||||||||||||||
| All | 2.8 | 2.4 | 2.0 | 2.3 | 2.1 | 1.9 | 2.0 | 2.2 | 2.2 | 2.2 | 2.4 | 2.3 | 2.5 | 2.1 | 2.0 | 2.3 | 2.2 | ||
| Previous years | |||||||||||||||||||
| All previous years | 2.6 | 2.2 | 1.9 | 2.1 | 2.0 | 1.8 | 1.9 | 2.0 | 2.2 | 2.1 | 2.4 | 2.2 | 2.3 | 2.0 | 1.9 | 2.2 | 2.1 | ||
| Previous 30 years | 2.6 | 2.2 | 1.9 | 2.1 | 2.0 | 1.8 | 1.9 | 2.0 | 2.2 | 2.1 | 2.4 | 2.2 | 2.3 | 2.0 | 1.9 | 2.2 | 2.1 | ||
| Previous 20 years | 2.9 | 2.5 | 2.0 | 2.3 | 2.2 | 1.8 | 2.0 | 2.2 | 2.2 | 2.1 | 2.6 | 2.4 | 2.5 | 2.2 | 2.0 | 2.3 | 2.2 | ||
| 10 year groups | |||||||||||||||||||
| [2007,2017) | 3.5 | 3.0 | 2.3 | 2.5 | 2.6 | 2.1 | 2.2 | 2.4 | 2.4 | 2.3 | 3.0 | 2.8 | 3.0 | 2.5 | 2.2 | 2.5 | 2.5 | ||
| [1997,2007) | 1.8 | 1.5 | 1.4 | 1.5 | 1.4 | 1.3 | 1.5 | 1.7 | 1.8 | 1.7 | 1.5 | 1.4 | 1.6 | 1.4 | 1.5 | 1.7 | 1.5 | ||
| [1987,1997) | 1.7 | 1.5 | 1.5 | 1.3 | 1.3 | 1.4 | 1.4 | 1.3 | 1.8 | 2.0 | 1.9 | 1.6 | 1.6 | 1.4 | 1.4 | 1.9 | 1.5 | ||
| 5 year groups | |||||||||||||||||||
| [2012,2017) | 3.6 | 3.1 | 2.4 | 2.5 | 2.5 | 2.2 | 2.3 | 2.5 | 2.6 | 2.5 | 3.1 | 2.8 | 3.1 | 2.5 | 2.3 | 2.7 | 2.6 | ||
| [2007,2012) | 3.2 | 2.5 | 2.0 | 2.5 | 2.7 | 1.9 | 1.7 | 2.1 | 2.0 | 1.9 | 2.8 | 2.7 | 2.8 | 2.4 | 1.9 | 2.1 | 2.3 | ||
| [2002,2007) | 1.9 | 1.6 | 1.3 | 1.4 | 1.3 | 1.3 | 1.4 | 1.7 | 1.8 | 1.8 | 1.7 | 1.5 | 1.7 | 1.3 | 1.4 | 1.8 | 1.5 | ||
| [1997,2002) | 1.7 | 1.4 | 1.6 | 1.7 | 1.4 | 1.3 | 1.7 | 1.6 | 1.7 | 1.5 | 1.3 | 1.3 | 1.4 | 1.6 | 1.5 | 1.5 | 1.5 | ||
| [1992,1997) | 3.0 | 2.0 | 2.4 | 1.9 | 2.0 | 2.1 | 2.2 | 1.3 | 2.0 | 2.4 | 2.7 | 1.4 | 2.1 | 2.1 | 1.9 | 2.3 | 2.1 | ||
| [1987,1992) | 1.1 | 1.2 | 1.0 | 1.1 | 1.0 | 1.1 | 0.9 | 1.3 | 1.7 | 1.8 | 1.5 | 1.6 | 1.3 | 1.0 | 1.1 | 1.7 | 1.3 | ||
| Year | |||||||||||||||||||
| 2017 | 3.9 | 3.3 | 2.5 | 3.2 | 2.6 | 2.5 | 2.4 | 2.6 | 2.7 | 2.8 | 2.5 | 2.8 | 3.2 | 2.8 | 2.5 | 2.7 | 2.8 | ||
| 2016 | 4.3 | 3.3 | 2.6 | 2.8 | 3.1 | 2.6 | 2.9 | 2.6 | 3.0 | 2.8 | 3.5 | 3.5 | 3.7 | 2.8 | 2.7 | 3.1 | 3.0 | ||
| 2015 | 3.9 | 3.8 | 3.2 | 2.8 | 2.6 | 2.4 | 2.6 | 2.8 | 2.4 | 2.6 | 3.3 | 3.1 | 3.5 | 2.9 | 2.6 | 2.7 | 2.9 | ||
| 2014 | 3.5 | 2.9 | 2.3 | 2.6 | 2.7 | 2.5 | 2.2 | 2.9 | 3.0 | 3.2 | 3.0 | 2.1 | 2.7 | 2.6 | 2.4 | 3.1 | 2.7 | ||
| 2013 | 2.7 | 3.3 | 1.9 | 2.1 | 2.0 | 1.6 | 1.5 | 1.5 | 2.3 | 1.6 | 2.3 | 2.3 | 2.7 | 2.0 | 1.5 | 2.0 | 2.0 | ||
| 2012 | 2.2 | 1.2 | 1.3 | 1.7 | 1.5 | 1.6 | 1.2 | 1.6 | 1.7 | 1.6 | 2.1 | 1.9 | 1.7 | 1.6 | 1.4 | 1.7 | 1.6 | ||
| 2011 | 4.4 | 3.6 | 3.3 | 3.5 | 2.5 | 1.6 | 1.7 | 1.6 | 1.7 | 1.9 | 2.0 | 2.0 | 2.8 | 3.2 | 1.6 | 1.8 | 2.3 | ||
| 2010 | 6.0 | 2.4 | 1.6 | 2.9 | 2.7 | 2.1 | 1.5 | 2.2 | 2.6 | 1.9 | 2.9 | 3.9 | 4.0 | 2.5 | 1.9 | 2.4 | 2.6 | ||
| 2009 | 1.7 | 2.0 | 1.8 | 2.1 | 2.1 | 1.5 | 1.9 | 2.0 | 2.2 | 1.8 | 1.7 | 2.5 | 2.1 | 2.0 | 1.7 | 1.9 | 2.0 | ||
| 2008 | 2.8 | 2.1 | 1.9 | 2.1 | 3.2 | 1.8 | 2.5 | 1.9 | 2.0 | 1.9 | 4.1 | 2.0 | 2.3 | 2.2 | 2.0 | 2.3 | 2.2 | ||
| 2007 | 1.5 | 1.9 | 1.4 | 2.0 | 3.4 | 2.5 | 1.4 | 3.1 | 1.6 | 1.9 | 4.7 | 3.1 | 2.5 | 2.1 | 2.2 | 2.4 | 2.3 | ||
| 2006 | 1.7 | 1.4 | 1.3 | 2.4 | 1.7 | 1.4 | 2.4 | 1.8 | 2.0 | 2.8 | 1.3 | 1.7 | 1.7 | 1.9 | 1.9 | 2.1 | 1.9 | ||
| 2005 | 1.3 | 1.0 | 1.1 | 0.9 | 1.6 | 1.7 | 1.3 | 1.8 | 1.8 | 1.5 | 2.1 | 1.7 | 1.4 | 1.2 | 1.6 | 1.8 | 1.5 | ||
| 2004 | 2.0 | 1.7 | 1.4 | 0.8 | 1.0 | 1.3 | 1.0 | 1.4 | 1.2 | 1.5 | 2.2 | 1.3 | 1.7 | 1.1 | 1.2 | 1.6 | 1.4 | ||
| 2003 | 1.5 | 1.5 | 1.5 | 0.6 | 1.1 | 1.1 | 0.8 | 1.7 | 1.8 | 1.7 | 1.0 | 1.3 | 1.4 | 1.1 | 1.2 | 1.6 | 1.3 | ||
| 2002 | 2.7 | 2.3 | 1.3 | 1.1 | 1.3 | 1.2 | 1.0 | 1.6 | 2.0 | 1.5 | 1.5 | 1.5 | 2.1 | 1.3 | 1.2 | 1.7 | 1.5 | ||
| 2001 | 2.0 | 1.5 | 2.0 | 1.8 | 1.8 | 1.7 | 1.8 | 1.8 | 1.8 | 1.7 | 1.3 | 1.4 | 1.6 | 1.9 | 1.7 | 1.7 | 1.7 | ||
| 2000 | 2.0 | 1.5 | 1.8 | 1.6 | 1.8 | 1.2 | 1.7 | 1.8 | 1.9 | 1.4 | 1.6 | 1.7 | 1.7 | 1.7 | 1.5 | 1.7 | 1.6 | ||
| 1999 | 1.6 | 1.4 | 1.3 | 2.2 | 1.1 | 1.8 | 2.0 | 1.5 | 2.1 | 1.6 | 1.4 | 1.5 | 1.5 | 1.5 | 1.8 | 1.7 | 1.6 | ||
| 1998 | 0.8 | 1.2 | 1.2 | 1.1 | 1.1 | 0.7 | 1.4 | 1.5 | 0.4 | 0.6 | 0.6 | 0.5 | 0.8 | 1.1 | 1.1 | 0.5 | 0.9 | ||
| 1997 | 1.1 | 1.2 | 0.5 | 1.2 | 0.8 | 0.6 | 1.3 | 1.2 | 1.8 | 1.2 | 1.0 | 0.2 | 0.8 | 0.8 | 0.9 | 1.3 | 0.9 | ||
| 1996 | 1.2 | 1.2 | 1.1 | 0.9 | 1.2 | 1.7 | 1.6 | 0.8 | 1.0 | 1.6 | 1.6 | 1.7 | 1.4 | 1.0 | 1.4 | 1.3 | 1.3 | ||
| 1995 | 2.0 | 1.3 | 1.3 | 1.4 | 0.9 | 1.3 | 1.8 | 0.9 | 2.3 | 1.6 | 3.7 | 1.2 | 1.5 | 1.2 | 1.4 | 2.4 | 1.6 | ||
| 1994 | 3.9 | 3.3 | 2.2 | 3.1 | 2.7 | 3.1 | 4.5 | 1.0 | 1.8 | 3.0 | 1.5 | 1.2 | 2.6 | 2.7 | 2.9 | 2.2 | 2.6 | ||
| 1993 | 1.5 | 2.6 | 5.8 | 2.0 | 3.8 | 4.4 | 2.1 | 2.3 | 2.7 | 2.8 | 3.5 | 1.4 | 1.9 | 3.7 | 3.0 | 3.0 | 2.9 | ||
| 1992 | 7.0 | 2.0 | 2.6 | 2.6 | 2.2 | 1.5 | 1.4 | 2.5 | 2.3 | 3.3 | 2.9 | 1.8 | 3.7 | 2.5 | 1.7 | 2.8 | 2.7 | ||
| 1991 | 2.0 | 2.6 | 2.3 | 1.8 | 3.5 | 1.4 | 2.1 | 4.0 | 3.0 | 4.2 | 3.8 | 2.9 | 2.4 | 2.6 | 2.4 | 3.7 | 2.7 | ||
| 1990 | 1.1 | 0.7 | 0.9 | 1.0 | 0.3 | 1.9 | 1.0 | 1.5 | 6.6 | 5.1 | 4.0 | 3.2 | 1.3 | 0.7 | 1.5 | 5.3 | 2.0 | ||
| 1989 | 0.9 | 1.2 | 0.9 | 1.1 | 0.7 | 0.9 | 0.9 | 1.2 | 0.9 | 1.3 | 1.4 | 1.9 | 1.3 | 0.9 | 1.0 | 1.2 | 1.1 | ||
| 1988 | 0.8 | 0.9 | 0.9 | 0.8 | 0.7 | 0.9 | 0.8 | 1.3 | 0.8 | 1.1 | 0.8 | 1.0 | 0.9 | 0.8 | 1.0 | 0.9 | 0.9 | ||
| 1987 | 3.5 | 2.5 | 0.8 | 1.1 | 0.8 | 1.0 | 0.9 | 0.8 | 0.8 | 1.0 | 0.8 | 1.1 | 1.3 | 0.9 | 0.9 | 0.9 | 0.9 | ||
| 1986 | 2.2 | 2.2 | 1.1 | 3.3 | 2.0 | 2.5 | 1.5 | 3.2 | 2.0 | 2.5 | 1.4 | 3.4 | 2.6 | 2.0 | 2.5 | 2.1 | 2.3 | ||
| 1985 | 0.9 | 2.2 | 0.8 | 1.4 | 1.1 | 2.2 | 2.2 | 5.2 | 2.8 | 5.1 | 2.5 | 2.5 | 1.8 | 1.1 | 2.8 | 3.8 | 1.9 | ||
| 1984 | 0.0 | 0.0 | 0.0 | 0.2 | 0.0 | 1.7 | 1.2 | 0.3 | 0.6 | 0.4 | 1.2 | 0.2 | 0.1 | 0.1 | 0.9 | 0.8 | 0.6 | ||
| 1983 | 0.0 | 0.1 | 0.0 | 0.2 | 0.2 | 0.1 | 0.0 | 0.1 | 0.0 | - | 0.0 | 0.0 | 0.0 | 0.1 | 0.1 | 0.0 | 0.1 | ||
| 1982 | - | 0.0 | - | 0.0 | 0.0 | 0.1 | - | 0.0 | - | 0.0 | - | 0.0 | 0.0 | 0.0 | 0.0 | 0.0 | 0.0 | ||
Reporting rates
Reporting rate is the proportion of all surveys in which the species was present.
Reporting rate by year
This chart shows the reporting rate of Australian Magpie each year between 1982 and 2017. 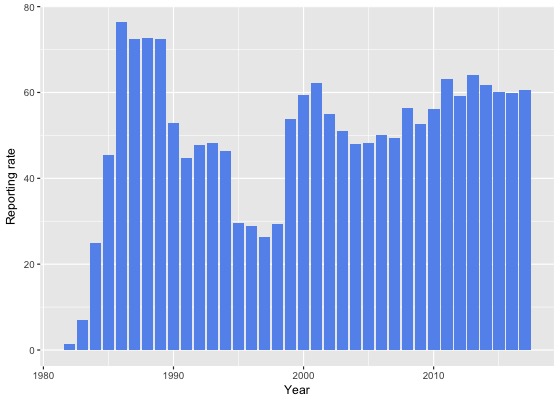
Reporting rate by month
This chart shows the reporting rate by month of Australian Magpie. The blue lines show the reporting rate for the twelve months to June 2017 and the bars show the average reporting rate for the period 1982 to 2017. 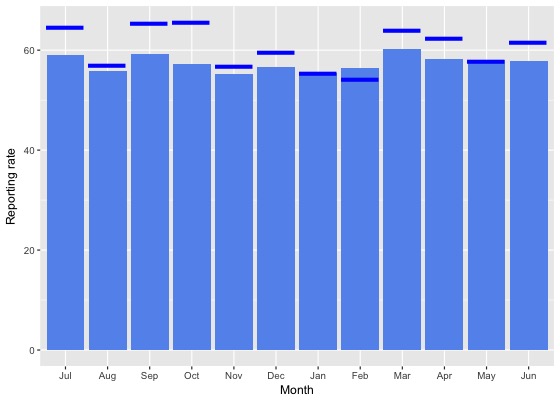
Reporting rate by season
This chart shows the seasonal reporting rate of Australian Magpie. The blue lines show the seasonal reporting rate for the twelve months to June 2017 and the bars show the average seasonal reporting rate for the period 1982 to 2017. 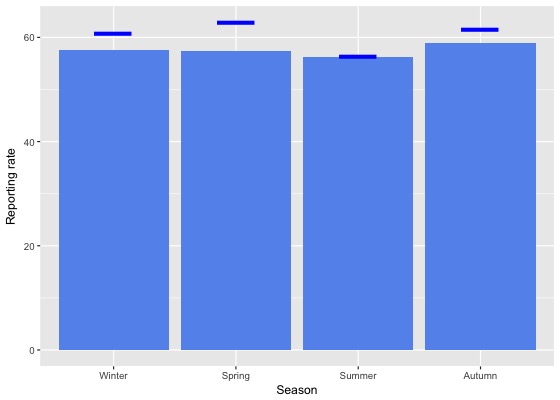
Reporting rate data
| Month | Season | ||||||||||||||||||
|---|---|---|---|---|---|---|---|---|---|---|---|---|---|---|---|---|---|---|---|
| Period | Jul | Aug | Sep | Oct | Nov | Dec | Jan | Feb | Mar | Apr | May | Jun | Winter | Spring | Summer | Autumn | All | ||
| All years | |||||||||||||||||||
| All | 59.1 | 55.7 | 59.2 | 57.2 | 55.3 | 56.7 | 55.4 | 56.5 | 60.2 | 58.3 | 57.9 | 57.8 | 57.5 | 57.3 | 56.2 | 58.9 | 57.5 | ||
| Previous years | |||||||||||||||||||
| All previous years | 58.2 | 55.5 | 58.3 | 56.1 | 55.0 | 56.2 | 55.4 | 56.9 | 59.5 | 57.6 | 58.0 | 57.1 | 56.9 | 56.5 | 56.1 | 58.4 | 57.0 | ||
| Previous 30 years | 58.3 | 55.8 | 58.5 | 56.3 | 55.1 | 56.6 | 55.4 | 57.0 | 59.6 | 57.7 | 58.1 | 57.3 | 57.1 | 56.7 | 56.3 | 58.5 | 57.1 | ||
| Previous 20 years | 57.8 | 55.6 | 58.4 | 56.4 | 54.5 | 56.6 | 55.2 | 56.7 | 59.9 | 57.3 | 57.6 | 57.6 | 57.1 | 56.5 | 56.1 | 58.4 | 57.0 | ||
| 10 year groups | |||||||||||||||||||
| [2007,2017) | 62.6 | 58.1 | 60.5 | 58.4 | 58.4 | 60.0 | 57.2 | 57.8 | 60.8 | 59.1 | 61.4 | 60.1 | 60.2 | 59.0 | 58.3 | 60.3 | 59.4 | ||
| [1997,2007) | 49.5 | 50.2 | 54.1 | 49.2 | 46.7 | 50.1 | 48.5 | 53.9 | 58.1 | 52.5 | 48.4 | 52.4 | 50.9 | 50.3 | 50.6 | 53.9 | 51.4 | ||
| [1987,1997) | 60.3 | 56.2 | 59.3 | 56.1 | 57.2 | 56.8 | 56.2 | 58.6 | 57.5 | 59.7 | 60.0 | 55.7 | 57.3 | 57.4 | 57.2 | 59.1 | 57.7 | ||
| 5 year groups | |||||||||||||||||||
| [2012,2017) | 66.2 | 61.1 | 61.8 | 59.5 | 60.1 | 61.1 | 58.6 | 58.8 | 60.4 | 61.1 | 63.0 | 61.0 | 62.5 | 60.3 | 59.4 | 61.3 | 60.7 | ||
| [2007,2012) | 52.2 | 47.3 | 57.7 | 56.6 | 53.5 | 57.7 | 52.5 | 53.3 | 61.7 | 54.4 | 56.7 | 58.5 | 54.5 | 56.3 | 54.9 | 57.6 | 56.0 | ||
| [2002,2007) | 50.1 | 49.1 | 55.5 | 47.4 | 45.1 | 50.3 | 43.7 | 50.8 | 56.9 | 52.6 | 44.8 | 53.4 | 51.2 | 49.6 | 48.5 | 52.6 | 50.5 | ||
| [1997,2002) | 48.5 | 51.4 | 52.5 | 51.9 | 48.6 | 49.8 | 53.9 | 57.0 | 59.8 | 52.5 | 52.7 | 50.9 | 50.4 | 51.1 | 53.1 | 55.5 | 52.6 | ||
| [1992,1997) | 44.0 | 38.2 | 41.2 | 37.3 | 48.2 | 36.7 | 36.8 | 34.1 | 35.5 | 39.0 | 40.8 | 30.6 | 37.2 | 42.2 | 36.0 | 38.3 | 38.7 | ||
| [1987,1992) | 67.7 | 66.0 | 67.8 | 66.4 | 61.5 | 65.6 | 66.9 | 67.9 | 70.6 | 71.5 | 70.0 | 69.9 | 67.8 | 65.0 | 66.8 | 70.7 | 67.4 | ||
| Year | |||||||||||||||||||
| 2017 | 64.5 | 57.0 | 65.3 | 65.5 | 56.9 | 59.6 | 55.5 | 54.2 | 64.1 | 62.4 | 57.8 | 61.5 | 60.9 | 62.9 | 56.3 | 61.5 | 60.5 | ||
| 2016 | 64.7 | 56.0 | 57.0 | 58.7 | 62.5 | 56.6 | 58.0 | 55.4 | 60.9 | 62.2 | 66.7 | 64.6 | 61.4 | 59.1 | 56.7 | 62.9 | 60.0 | ||
| 2015 | 66.7 | 67.6 | 67.4 | 60.5 | 56.7 | 58.1 | 56.0 | 59.0 | 54.7 | 59.1 | 62.8 | 59.9 | 63.8 | 61.6 | 57.6 | 58.5 | 60.1 | ||
| 2014 | 67.3 | 59.7 | 60.0 | 62.6 | 61.5 | 69.6 | 63.3 | 60.9 | 59.6 | 66.8 | 54.4 | 56.9 | 59.9 | 61.6 | 63.9 | 60.8 | 61.8 | ||
| 2013 | 61.8 | 61.1 | 64.7 | 55.7 | 63.1 | 67.4 | 64.1 | 68.3 | 69.3 | 65.1 | 65.3 | 61.4 | 61.4 | 60.3 | 66.4 | 67.0 | 64.0 | ||
| 2012 | 72.3 | 67.7 | 62.1 | 60.1 | 56.8 | 60.9 | 52.7 | 56.6 | 59.8 | 51.2 | 56.1 | 59.6 | 65.9 | 59.8 | 56.1 | 55.5 | 59.2 | ||
| 2011 | 56.1 | 46.4 | 64.3 | 65.5 | 54.5 | 67.9 | 68.9 | 66.7 | 65.0 | 60.5 | 59.3 | 63.4 | 58.3 | 63.2 | 68.0 | 61.7 | 63.2 | ||
| 2010 | 58.3 | 43.0 | 59.6 | 56.4 | 57.4 | 50.2 | 54.1 | 45.9 | 66.1 | 51.9 | 56.9 | 60.7 | 55.9 | 57.5 | 51.0 | 58.9 | 56.1 | ||
| 2009 | 54.7 | 59.4 | 57.9 | 52.5 | 47.3 | 51.9 | 46.0 | 44.2 | 55.3 | 53.3 | 44.3 | 60.4 | 58.4 | 52.8 | 47.9 | 52.0 | 52.7 | ||
| 2008 | 51.7 | 51.3 | 58.1 | 56.4 | 59.1 | 61.7 | 53.2 | 47.2 | 61.8 | 51.9 | 54.1 | 61.7 | 56.1 | 57.2 | 55.9 | 55.3 | 56.3 | ||
| 2007 | 37.4 | 38.0 | 48.1 | 52.3 | 50.7 | 53.7 | 32.7 | 48.7 | 57.9 | 53.0 | 66.7 | 47.6 | 43.7 | 50.8 | 44.8 | 57.8 | 49.5 | ||
| 2006 | 43.4 | 48.5 | 54.6 | 50.4 | 43.5 | 52.0 | 50.6 | 56.3 | 53.7 | 47.8 | 39.9 | 52.1 | 48.8 | 50.1 | 52.6 | 49.2 | 50.1 | ||
| 2005 | 39.0 | 31.8 | 48.3 | 42.5 | 35.2 | 49.0 | 42.6 | 45.7 | 61.5 | 54.1 | 47.8 | 57.6 | 47.1 | 43.4 | 46.5 | 54.8 | 48.1 | ||
| 2004 | 56.0 | 57.2 | 52.9 | 43.6 | 43.6 | 43.8 | 41.8 | 37.4 | 49.2 | 46.7 | 40.8 | 51.5 | 55.0 | 47.1 | 41.8 | 46.4 | 47.9 | ||
| 2003 | 44.4 | 50.4 | 55.9 | 45.1 | 50.0 | 49.6 | 34.1 | 57.7 | 60.1 | 58.1 | 43.4 | 49.7 | 48.4 | 50.7 | 48.5 | 55.5 | 51.0 | ||
| 2002 | 60.0 | 53.4 | 68.2 | 51.1 | 49.5 | 55.2 | 47.2 | 49.3 | 60.5 | 55.4 | 52.9 | 54.3 | 56.2 | 56.0 | 51.8 | 57.3 | 55.1 | ||
| 2001 | 60.4 | 66.9 | 62.9 | 63.0 | 63.6 | 71.7 | 58.5 | 63.9 | 64.8 | 56.6 | 47.4 | 58.6 | 61.6 | 63.1 | 65.5 | 58.2 | 62.1 | ||
| 2000 | 56.3 | 60.8 | 66.0 | 61.7 | 56.0 | 45.2 | 57.9 | 63.3 | 66.9 | 60.2 | 57.3 | 64.0 | 60.9 | 61.2 | 54.3 | 62.5 | 59.3 | ||
| 1999 | 41.2 | 30.9 | 45.4 | 45.9 | 51.9 | 53.8 | 56.2 | 58.6 | 65.9 | 59.8 | 63.1 | 51.9 | 44.9 | 47.6 | 56.1 | 62.9 | 53.8 | ||
| 1998 | 27.0 | 39.6 | 35.0 | 26.1 | 32.7 | 22.6 | 38.2 | 30.2 | 21.5 | 25.6 | 29.6 | 26.7 | 30.9 | 31.7 | 29.1 | 23.9 | 29.5 | ||
| 1997 | 18.4 | 27.6 | 24.5 | 31.6 | 23.1 | 26.9 | 31.4 | 31.6 | 35.0 | 25.7 | 35.6 | 18.1 | 20.7 | 25.7 | 29.2 | 29.9 | 26.2 | ||
| 1996 | 37.3 | 23.4 | 34.7 | 24.6 | 30.6 | 33.3 | 27.2 | 23.5 | 20.6 | 34.4 | 32.8 | 31.0 | 29.8 | 29.3 | 28.2 | 27.7 | 28.8 | ||
| 1995 | 35.5 | 24.0 | 19.4 | 25.6 | 24.5 | 27.6 | 38.9 | 27.0 | 36.7 | 29.8 | 39.0 | 30.9 | 29.4 | 23.6 | 32.3 | 34.4 | 29.5 | ||
| 1994 | 49.0 | 58.4 | 70.6 | 52.3 | 66.9 | 43.5 | 45.6 | 34.5 | 34.1 | 38.9 | 31.2 | 25.8 | 42.9 | 63.4 | 41.3 | 35.5 | 46.4 | ||
| 1993 | 38.8 | 55.1 | 54.8 | 48.0 | 66.7 | 60.9 | 38.8 | 50.0 | 44.4 | 43.3 | 45.5 | 33.3 | 43.4 | 56.2 | 49.6 | 44.5 | 48.3 | ||
| 1992 | 63.1 | 44.4 | 40.0 | 51.1 | 58.3 | 31.7 | 37.9 | 53.7 | 46.5 | 59.3 | 53.9 | 33.3 | 47.5 | 49.4 | 39.5 | 52.9 | 47.9 | ||
| 1991 | 42.5 | 36.2 | 36.0 | 40.8 | 48.5 | 33.8 | 41.1 | 46.0 | 54.0 | 61.0 | 54.1 | 58.0 | 43.2 | 42.0 | 39.4 | 56.3 | 44.7 | ||
| 1990 | 70.3 | 62.7 | 40.9 | 40.8 | 37.4 | 52.8 | 50.0 | 52.1 | 56.8 | 48.8 | 50.7 | 51.3 | 63.5 | 39.6 | 51.6 | 52.2 | 52.9 | ||
| 1989 | 79.6 | 73.3 | 72.9 | 72.7 | 64.6 | 68.3 | 72.9 | 71.6 | 73.9 | 74.4 | 71.1 | 75.6 | 76.0 | 70.5 | 70.8 | 73.2 | 72.5 | ||
| 1988 | 69.4 | 72.0 | 80.3 | 68.8 | 65.1 | 71.8 | 64.8 | 79.4 | 74.8 | 77.0 | 77.3 | 77.3 | 72.7 | 70.1 | 71.7 | 76.3 | 72.6 | ||
| 1987 | 72.7 | 73.3 | 75.3 | 77.7 | 68.1 | 72.5 | 76.9 | 65.8 | 74.6 | 75.3 | 73.4 | 67.6 | 68.3 | 73.2 | 71.4 | 74.4 | 72.6 | ||
| 1986 | 73.1 | 81.6 | 66.0 | 80.6 | 74.5 | 64.7 | 73.9 | 91.7 | 71.0 | 80.4 | 75.9 | 82.9 | 79.8 | 72.8 | 77.4 | 76.6 | 76.3 | ||
| 1985 | 50.0 | 36.7 | 28.8 | 32.6 | 43.9 | 30.0 | 62.5 | 100.0 | 72.7 | 84.2 | 70.0 | 71.4 | 52.3 | 34.9 | 47.1 | 77.5 | 45.3 | ||
| 1984 | 0.0 | 0.0 | 0.0 | 8.3 | 0.0 | 16.7 | 62.1 | 15.2 | 40.7 | 17.6 | 41.9 | 8.8 | 6.1 | 4.8 | 33.8 | 32.6 | 25.0 | ||
| 1983 | 0.0 | 8.3 | 0.0 | 15.4 | 22.2 | 7.7 | 0.0 | 9.1 | 0.0 | - | 0.0 | 0.0 | 3.4 | 14.8 | 6.7 | 0.0 | 7.0 | ||
| 1982 | - | 0.0 | - | 0.0 | 0.0 | 7.1 | - | 0.0 | - | 0.0 | - | 0.0 | 0.0 | 0.0 | 4.0 | 0.0 | 1.4 | ||
Breeding data
Breeding records by month
Number of breeding records by breeding code and month, 2017 and all years| Breeding code | Jul | Aug | Sep | Oct | Nov | Dec | Jan | Feb | Mar | Apr | May | Jun |
|---|---|---|---|---|---|---|---|---|---|---|---|---|
| 2017 | ||||||||||||
| Breeding (BLA code) | 0 | 0 | 0 | 0 | 0 | 0 | 0 | 0 | 0 | 0 | 0 | 0 |
| Carrying Food | 0 | 0 | 7 | 5 | 2 | 0 | 1 | 0 | 0 | 0 | 0 | 0 |
| Copulating | 0 | 0 | 0 | 0 | 0 | 0 | 0 | 0 | 0 | 0 | 0 | 0 |
| Display | 0 | 1 | 0 | 0 | 0 | 0 | 0 | 0 | 0 | 0 | 0 | 1 |
| Dependent young | 0 | 0 | 3 | 97 | 79 | 29 | 17 | 3 | 1 | 2 | 0 | 0 |
| Faecal sac | 0 | 0 | 0 | 0 | 0 | 0 | 1 | 0 | 0 | 0 | 0 | 0 |
| Inspecting hollow | 0 | 0 | 0 | 0 | 0 | 0 | 0 | 0 | 0 | 0 | 0 | 0 |
| Nest building | 5 | 14 | 0 | 1 | 0 | 0 | 0 | 0 | 0 | 0 | 0 | 0 |
| Nest with eggs | 0 | 0 | 0 | 0 | 0 | 0 | 0 | 0 | 0 | 0 | 0 | 0 |
| Nest with young | 0 | 0 | 7 | 22 | 3 | 0 | 2 | 0 | 0 | 0 | 0 | 0 |
| On/leaving nest | 1 | 7 | 38 | 13 | 1 | 2 | 0 | 0 | 0 | 0 | 0 | 0 |
| All years | ||||||||||||
| Breeding (BLA code) | 0 | 4 | 10 | 43 | 29 | 15 | 10 | 0 | 0 | 0 | 1 | 0 |
| Carrying Food | 2 | 2 | 24 | 50 | 6 | 2 | 1 | 0 | 0 | 0 | 0 | 0 |
| Copulating | 0 | 1 | 1 | 0 | 0 | 0 | 0 | 0 | 0 | 0 | 0 | 0 |
| Display | 0 | 1 | 0 | 1 | 0 | 0 | 0 | 0 | 0 | 0 | 0 | 1 |
| Dependent young | 2 | 5 | 20 | 705 | 558 | 294 | 145 | 29 | 6 | 5 | 3 | 2 |
| Faecal sac | 0 | 0 | 0 | 0 | 0 | 0 | 1 | 0 | 0 | 0 | 0 | 0 |
| Inspecting hollow | 0 | 0 | 0 | 1 | 0 | 0 | 0 | 0 | 0 | 0 | 0 | 0 |
| Nest building | 64 | 93 | 47 | 58 | 36 | 8 | 5 | 2 | 2 | 0 | 0 | 2 |
| Nest with eggs | 1 | 17 | 33 | 14 | 3 | 1 | 0 | 0 | 0 | 0 | 0 | 0 |
| Nest with young | 0 | 7 | 97 | 225 | 32 | 5 | 2 | 0 | 0 | 0 | 0 | 0 |
| On/leaving nest | 4 | 63 | 169 | 131 | 11 | 3 | 1 | 0 | 1 | 0 | 0 | 0 |
Breeding records by year
Average number of breeding records per period by breeding code| Period | Breeding (BLA code) | Carrying Food | Copulating | Display | Dependent young | Faecal sac | Inspecting hollow | Nest building | Nest with eggs | Nest with young | On/leaving nest |
|---|---|---|---|---|---|---|---|---|---|---|---|
| All years | |||||||||||
| All | 3.1 | 2.4 | 0.1 | 0.1 | 49.3 | 0.0 | 0.0 | 8.8 | 1.9 | 10.2 | 10.6 |
| Previous years | |||||||||||
| All previous years | 3.2 | 2.1 | 0.1 | 0.0 | 44.1 | 0.0 | 0.0 | 8.5 | 2.0 | 9.5 | 9.2 |
| Previous 30 years | 3.7 | 2.4 | 0.1 | 0.0 | 51.1 | 0.0 | 0.0 | 9.5 | 2.3 | 11.1 | 10.7 |
| Previous 20 years | 5.6 | 2.1 | 0.1 | 0.0 | 54.2 | 0.0 | 0.0 | 4.0 | 0.3 | 10.7 | 14.2 |
| 10 year groups | |||||||||||
| [2007,2017) | 4.1 | 3.6 | 0.1 | 0.0 | 81.3 | 0.0 | 0.1 | 5.7 | 0.3 | 18.1 | 21.2 |
| [1997,2007) | 7.1 | 0.7 | 0.1 | 0.0 | 27.1 | 0.0 | 0.0 | 2.2 | 0.3 | 3.2 | 7.1 |
| [1987,1997) | 0.0 | 2.9 | 0.0 | 0.1 | 44.9 | 0.0 | 0.0 | 20.5 | 6.3 | 12.1 | 3.7 |
| 5 year groups | |||||||||||
| [2012,2017) | 3.6 | 4.6 | 0.2 | 0.0 | 97.2 | 0.0 | 0.2 | 8.6 | 0.6 | 20.4 | 27.2 |
| [2007,2012) | 4.6 | 2.6 | 0.0 | 0.0 | 65.4 | 0.0 | 0.0 | 2.8 | 0.0 | 15.8 | 15.2 |
| [2002,2007) | 2.8 | 0.8 | 0.2 | 0.0 | 31.8 | 0.0 | 0.0 | 1.6 | 0.6 | 4.2 | 8.0 |
| [1997,2002) | 11.4 | 0.6 | 0.0 | 0.0 | 22.4 | 0.0 | 0.0 | 2.8 | 0.0 | 2.2 | 6.2 |
| [1992,1997) | 0.0 | 0.4 | 0.0 | 0.2 | 15.6 | 0.0 | 0.0 | 3.0 | 0.0 | 2.4 | 5.4 |
| [1987,1992) | 0.0 | 5.4 | 0.0 | 0.0 | 74.2 | 0.0 | 0.0 | 38.0 | 12.6 | 21.8 | 2.0 |
| Year | |||||||||||
| 2017 | 0.0 | 15.0 | 0.0 | 2.0 | 231.0 | 1.0 | 0.0 | 20.0 | 0.0 | 34.0 | 62.0 |
| 2016 | 0.0 | 5.0 | 0.0 | 0.0 | 142.0 | 0.0 | 1.0 | 15.0 | 0.0 | 38.0 | 36.0 |
| 2015 | 0.0 | 7.0 | 1.0 | 0.0 | 100.0 | 0.0 | 0.0 | 16.0 | 3.0 | 36.0 | 43.0 |
| 2014 | 3.0 | 5.0 | 0.0 | 0.0 | 83.0 | 0.0 | 0.0 | 5.0 | 0.0 | 6.0 | 17.0 |
| 2013 | 6.0 | 3.0 | 0.0 | 0.0 | 99.0 | 0.0 | 0.0 | 2.0 | 0.0 | 13.0 | 24.0 |
| 2012 | 9.0 | 3.0 | 0.0 | 0.0 | 62.0 | 0.0 | 0.0 | 5.0 | 0.0 | 9.0 | 16.0 |
| 2011 | 0.0 | 4.0 | 0.0 | 0.0 | 95.0 | 0.0 | 0.0 | 3.0 | 0.0 | 11.0 | 14.0 |
| 2010 | 3.0 | 3.0 | 0.0 | 0.0 | 88.0 | 0.0 | 0.0 | 1.0 | 0.0 | 21.0 | 17.0 |
| 2009 | 13.0 | 4.0 | 0.0 | 0.0 | 49.0 | 0.0 | 0.0 | 4.0 | 0.0 | 17.0 | 18.0 |
| 2008 | 2.0 | 0.0 | 0.0 | 0.0 | 47.0 | 0.0 | 0.0 | 3.0 | 0.0 | 22.0 | 19.0 |
| 2007 | 5.0 | 2.0 | 0.0 | 0.0 | 48.0 | 0.0 | 0.0 | 3.0 | 0.0 | 8.0 | 8.0 |
| 2006 | 2.0 | 2.0 | 0.0 | 0.0 | 43.0 | 0.0 | 0.0 | 2.0 | 2.0 | 10.0 | 14.0 |
| 2005 | 1.0 | 1.0 | 1.0 | 0.0 | 25.0 | 0.0 | 0.0 | 2.0 | 0.0 | 5.0 | 4.0 |
| 2004 | 0.0 | 1.0 | 0.0 | 0.0 | 21.0 | 0.0 | 0.0 | 1.0 | 0.0 | 1.0 | 6.0 |
| 2003 | 3.0 | 0.0 | 0.0 | 0.0 | 26.0 | 0.0 | 0.0 | 2.0 | 0.0 | 3.0 | 10.0 |
| 2002 | 8.0 | 0.0 | 0.0 | 0.0 | 44.0 | 0.0 | 0.0 | 1.0 | 1.0 | 2.0 | 6.0 |
| 2001 | 21.0 | 0.0 | 0.0 | 0.0 | 33.0 | 0.0 | 0.0 | 1.0 | 0.0 | 3.0 | 6.0 |
| 2000 | 25.0 | 2.0 | 0.0 | 0.0 | 38.0 | 0.0 | 0.0 | 5.0 | 0.0 | 7.0 | 14.0 |
| 1999 | 11.0 | 0.0 | 0.0 | 0.0 | 29.0 | 0.0 | 0.0 | 1.0 | 0.0 | 1.0 | 4.0 |
| 1998 | 0.0 | 1.0 | 0.0 | 0.0 | 4.0 | 0.0 | 0.0 | 4.0 | 0.0 | 0.0 | 5.0 |
| 1997 | 0.0 | 0.0 | 0.0 | 0.0 | 8.0 | 0.0 | 0.0 | 3.0 | 0.0 | 0.0 | 2.0 |
| 1996 | 0.0 | 0.0 | 0.0 | 0.0 | 12.0 | 0.0 | 0.0 | 3.0 | 0.0 | 2.0 | 5.0 |
| 1995 | 0.0 | 1.0 | 0.0 | 0.0 | 11.0 | 0.0 | 0.0 | 3.0 | 0.0 | 3.0 | 6.0 |
| 1994 | 0.0 | 0.0 | 0.0 | 0.0 | 18.0 | 0.0 | 0.0 | 3.0 | 0.0 | 2.0 | 6.0 |
| 1993 | 0.0 | 0.0 | 0.0 | 1.0 | 18.0 | 0.0 | 0.0 | 2.0 | 0.0 | 2.0 | 4.0 |
| 1992 | 0.0 | 1.0 | 0.0 | 0.0 | 19.0 | 0.0 | 0.0 | 4.0 | 0.0 | 3.0 | 6.0 |
| 1991 | 0.0 | 1.0 | 0.0 | 0.0 | 15.0 | 0.0 | 0.0 | 13.0 | 2.0 | 3.0 | 7.0 |
| 1990 | 0.0 | 1.0 | 0.0 | 0.0 | 22.0 | 0.0 | 0.0 | 19.0 | 10.0 | 8.0 | 1.0 |
| 1989 | 0.0 | 12.0 | 0.0 | 0.0 | 98.0 | 0.0 | 0.0 | 65.0 | 18.0 | 28.0 | 1.0 |
| 1988 | 0.0 | 9.0 | 0.0 | 0.0 | 117.0 | 0.0 | 0.0 | 36.0 | 19.0 | 30.0 | 1.0 |
| 1987 | 0.0 | 4.0 | 0.0 | 0.0 | 119.0 | 0.0 | 0.0 | 57.0 | 14.0 | 40.0 | 0.0 |
| 1986 | 0.0 | 0.0 | 0.0 | 0.0 | 7.0 | 0.0 | 0.0 | 13.0 | 0.0 | 0.0 | 0.0 |
| 1985 | 0.0 | 0.0 | 0.0 | 0.0 | 3.0 | 0.0 | 0.0 | 0.0 | 0.0 | 0.0 | 1.0 |
| 1984 | 0.0 | 0.0 | 0.0 | 0.0 | 0.0 | 0.0 | 0.0 | 0.0 | 0.0 | 0.0 | 0.0 |
| 1983 | 0.0 | 0.0 | 0.0 | 0.0 | 0.0 | 0.0 | 0.0 | 0.0 | 0.0 | 0.0 | 0.0 |
| 1982 | 0.0 | 0.0 | 0.0 | 0.0 | 0.0 | 0.0 | 0.0 | 0.0 | 0.0 | 0.0 | 0.0 |
Distribution map
Distribution - 2017
This map shows the observed distribution of the Australian Magpie for 2017.
The red circles are the grid cells where Australian Magpie have been reported.
The transparency of the red circles indicate how many surveys sheets were submitted for that grid cell; the darker the red the more reliable the data. Of the 315 grid cells with reports, 83 had only one sheet; an example is grid number A11.
The size of the circle represents the reporting rate. The maximum reporting rate for Australian Magpie was 200.0% (eg grid number S25) and the minimum was 4.5% (eg grid number F17). 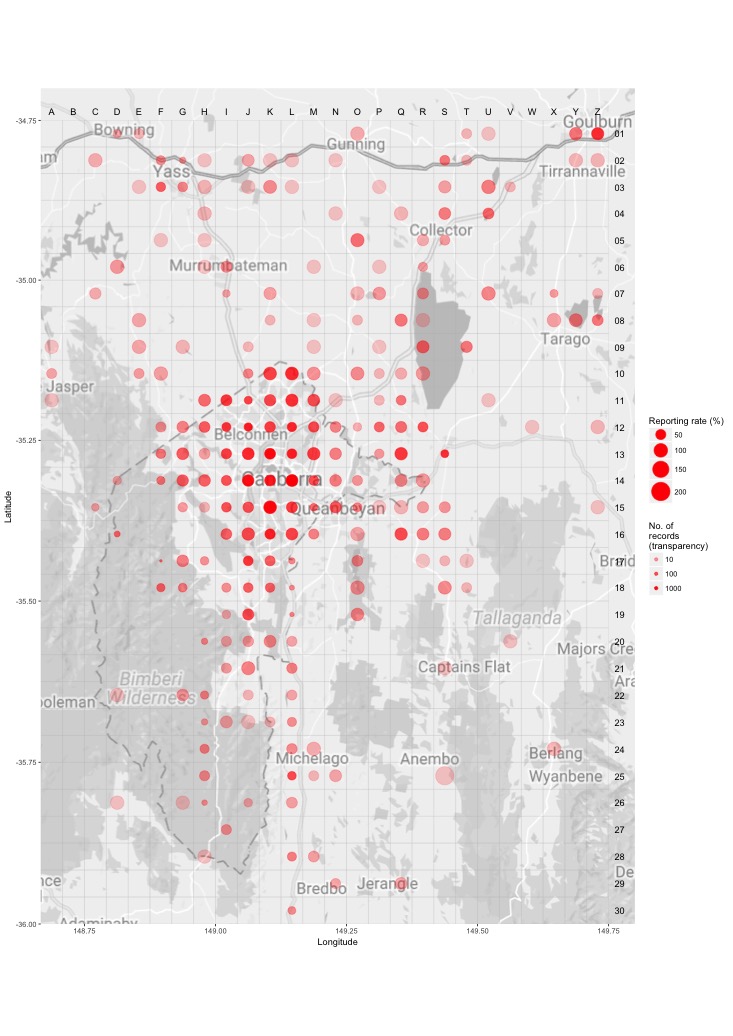
Distribution - all years
This map shows the observed distribution of the Australian Magpie for all years.
The red circles are the grid cells where Australian Magpie have been reported.
The transparency of the red circles indicate how many surveys sheets were submitted for that grid cell; the darker the red the more reliable the data. Of the 703 grid cells with reports, 55 had only one sheet; an example is grid number A12.
The size of the circle represents the reporting rate. The maximum reporting rate for Australian Magpie was 100.0% (eg grid number A12) and the minimum was 1.3% (eg grid number E16). 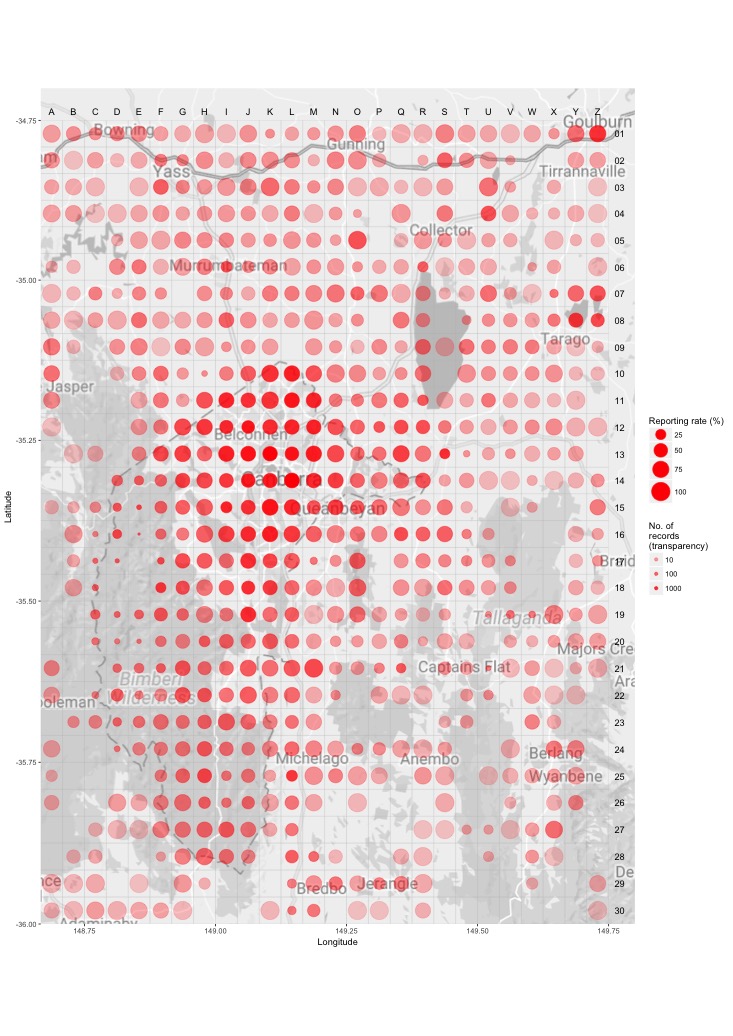
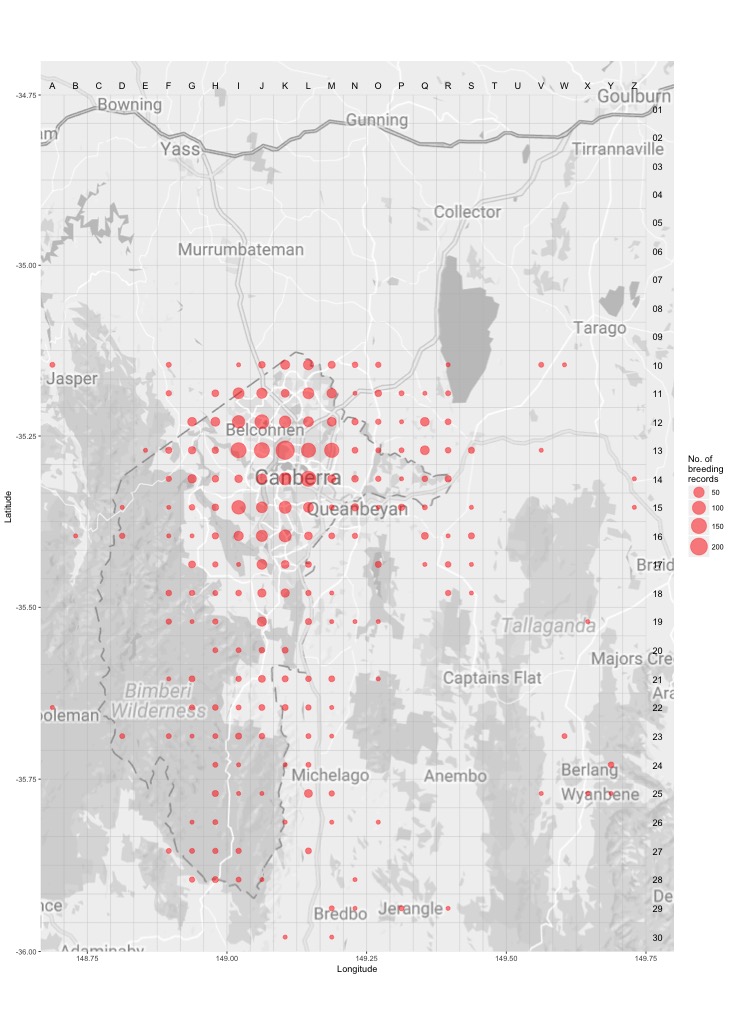
Breeding map
Breeding - 2017
This map shows the breeding distribution of the Australian Magpie for 2017.
The red circles are the grid cells where breeding activity for Australian Magpie have been reported.
The size of the circle represents the number of reports. 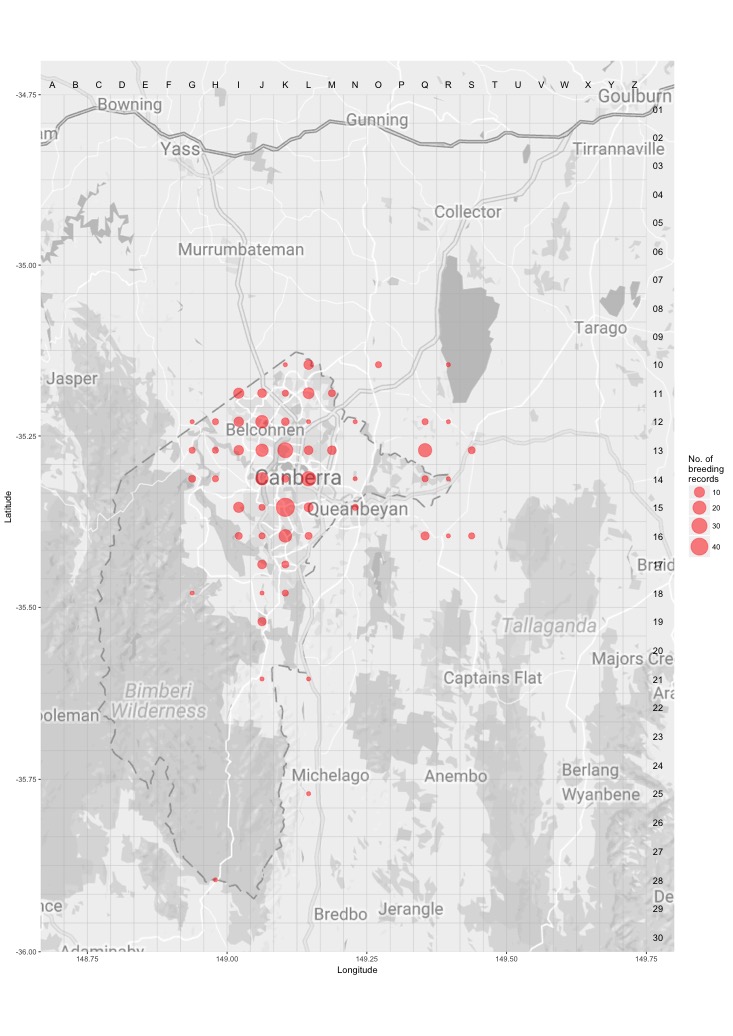
Breeding - all years
This map shows the breeding distribution of the Australian Magpie for all years.
The red circles are the grid cells where breeding activity for Australian Magpie have been reported.
The size of the circle represents the number of reports.